All published articles of this journal are available on ScienceDirect.

Design-Oriented Comparison of Reinforced Concrete Slab Systems for Residential Buildings in Kuwait
 iD
iD
Authors Info & Affiliations
Abstract
Introduction/Objective
This study compared six reinforced-concrete slab systems for a four-story residential building in Kuwait to identify priority-dependent performance trade-offs.
Methodology
Six ETABS models represented one-way slabs with beams in the x- and y-directions, a two-way solid slab, and three flat-slab configurations. Models shared geometry, materials, supports, loads, and shear walls; member sizing followed ACI 318-19, and loading followed ASCE/SEI 7-16. Outputs comprised reinforcement and concrete quantities, structural weight, concrete-and-reinforcing-steel material cost, material-associated embodied CO2, and comparative vertical natural frequency. A CRITIC-weighted multi-criteria analysis ranked alternatives across material efficiency, cost, embodied CO2, and frequency; sensitivity scenarios tested priority changes.
Results
The y-direction one-way slab required the least reinforcement (26,780 kg), had the highest vertical natural frequency (6.40 Hz), and ranked first under CRITIC and equal weighting. The drop-panel flat slab without edge beams had the lowest concrete quantity (298.39 m3), structural weight (7,161.37 kN), material cost (12,992.87 KD), and material-associated embodied CO2 (233,906.41 kg), but the lowest frequency (4.86 Hz). It ranked first in the material, cost, and emissions priority scenario.
Discussion
Results reveal a case-specific trade-off between material-based performance and vertical modal response. Natural frequency alone does not establish vibration acceptability.
Conclusion
For this case, the y-direction one-way slab was the highest-ranked overall compromise under CRITIC weighting; the drop-panel flat slab without edge beams was preferable under material-, cost-, and emissions-focused priorities. No system was universally optimal; selection should reflect project priorities and assessment boundaries.
1. INTRODUCTION
1.1. Research Background
The selection of a floor system represents a critical design decision in reinforced concrete residential buildings, as it determines the gravity load path, floor stiffness, serviceability, construction cycle, and a significant portion of total material consumption. Slab selection extends beyond flexural strength requirements, influencing deflection control, vibration performance, punching shear capacity, framing continuity, and the dimensions of beams, columns, and foundations. Therefore, the choice of slab system must be situated within a comprehensive framework of code-compliant structural performance. In conventional reinforced concrete design, this framework is primarily defined by ACI 318 for strength, detailing, and serviceability, in conjunction with ASCE/SEI 7-16 for gravity, wind, and seismic loading requirements [1, 2]. Recent analytical work on reinforced-concrete one-way and two-way slabs shows that support conditions, monolithic beam action, slab-panel configuration, and design coefficients influence bending moments, reinforcement demand, and slab integrity [3].
Within reinforced-concrete residential design in Kuwait, the prevailing structural-design approach follows a conventional code-compliance workflow. A three-dimensional structural model is created for the chosen framing system, with gravity and lateral loads applied. Structural members are then checked and iteratively sized to meet ultimate-strength and serviceability requirements as specified by the relevant design provisions [1, 2, 4]. While this process ensures safety and code compliance, it does not guarantee that the initially selected slab system is optimal regarding material consumption, structural weight, cost, or environmental impact. Research focused on value engineering in Kuwait has also identified unnecessary construction costs resulting from the oversizing of residential structural systems [5].
The approach utilized in this study enhances the conventional design workflow by incorporating an alternative-screening stage prior to selecting a slab system. The study evaluates systems using consistent building geometry, support conditions, material properties, loading assumptions, and lateral-force-resisting systems. The alternatives are compared based on reinforcement quantity, concrete quantity, structural weight, material cost, carbon dioxide emissions, and vertical natural frequency. This controlled comparison allows selection of the floor system that best meets the primary project objective, minimizing unnecessary material consumption and reducing the likelihood of subsequent redesign, while maintaining the required strength and serviceability verifications.
Recent regional studies indicate that structural decision-making is increasingly assessed through a broader performance perspective. Alqaryouti et al. [6], in a case study of a large 3D-printed villa in the Gulf region, emphasized the rising importance of sustainability, constructability, and material efficiency in residential construction. While 3D printing and cast-in-place reinforced concrete slabs represent distinct construction methods, both share the engineering objective of achieving adequate safety and serviceability while minimizing material use and environmental impact. Similarly, Shatnawi and Al-Qaryouti [7] and Alagawani and Al-Qaryouti [8] demonstrated that system-level stiffness, natural period, and ductility significantly influence whole-building dynamic performance. Collectively, these findings support the position that slab selection should be approached as a building-level engineering decision rather than as an isolated element design task.
The literature on slab selection is extensive yet fragmented. It encompasses historical and analytical studies on the evolution and behavior of two-way slabs [9, 10], code- and experiment-based research on punching shear, moment transfer, and slab-column response in flat slab systems [11-17], as well as comparative investigations of cost, embodied carbon, and optimization of alternative floor systems [18-24]. However, much of this research addresses a single failure mode, a specific slab type, or generalized sustainability comparisons, rather than directly comparing several conventional slab systems applied to an identical residential building geometry. For practicing engineers in Kuwait, there is a clear need for a case-based assessment of slab systems designed for the same architectural plan, under consistent loading assumptions, and evaluated using structural, economic, and environmental criteria. Therefore, this study compares six reinforced concrete slab systems commonly used in residential construction, one-way solid slabs with beams in the x- and y-directions, a two-way solid slab, a two-way flat slab, a two-way flat slab with drop panels, and a two-way flat slab with drop panels and edge beams, to identify the system that provides the most balanced performance for the selected residential case study.
1.2. Structural Behavior of Conventional Reinforced-concrete Slab Systems
The selection of a reinforced-concrete floor system influences the gravity-load path, member stiffness, deflection, vibration response, construction sequence, and the quantities of concrete and reinforcement required for the entire building. Conventional slab systems are typically designed under the strength and serviceability provisions of ACI 318-19 and the loading requirements of ASCE/SEI 7-16 [1, 2]. However, compliance with these provisions alone does not determine the slab system that yields the most efficient whole-building solution.
Juárez-Luna et al. [3] investigated bending-moment design coefficients for reinforced-concrete slabs and demonstrated the importance of support conditions, slab-panel configuration, and load-transfer behavior in determining design moments and reinforcement demand. Kamara et al. [9] reviewed the historical development of two-way slab analysis and design, showing how analytical assumptions and design procedures have evolved with improved understanding of slab behavior. Famiyesin et al. [10] compared numerical and analytical predictions of the limit load of rectangular two-way slabs, highlighting the influence of panel geometry and boundary conditions on slab capacity.
These studies establish a foundation for understanding one-way and two-way slab behavior. However, their primary focus remains on analytical procedures, design coefficients, or structural capacity. They do not offer a whole-building comparison of multiple conventional slab systems using identical architectural geometry and consistent structural, economic, and environmental assessment criteria. This distinction is significant because a slab system that is efficient at the element level may not minimize material consumption, structural weight, or cost at the building scale.
1.3. Flat Slabs, Drop Panels, and Edge Beams
Flat slab systems offer architectural and construction advantages by reducing or eliminating internal beams, creating a flatter soffit, and facilitating the routing of building services. However, their structural performance is significantly influenced by the slab-column connection, where punching shear, unbalanced moment transfer, slab rotation, and local deformation must be addressed.
Muttoni [11] investigated the punching shear strength of reinforced-concrete slabs without transverse reinforcement and established the importance of the slab-column load-transfer mechanism. Sagaseta et al. [12] examined punching behavior in flat slabs supported by rectangular columns, while Einpaul et al. [13] and Belletti et al. [14] investigated the effects of moment redistribution and compressive membrane action on punching resistance. Collectively, these studies show that flat slab behavior cannot be evaluated solely through flexural strength because the response of the slab-column region may govern the design.
Local strengthening arrangements have also received considerable attention. Qian and Li [15] experimentally examined the effect of drop panels on the response of reinforced-concrete flat slabs following the loss of a corner column. Grabski and Ambroziak [16] studied punching shear in flat slabs supported on columns incorporating concrete heads, whereas Bedeir et al. [17] investigated the influence of marginal beams on punching shear capacity at exterior columns. Hieu et al. [25] further examined the collapse response of flat slab structures incorporating drop panels under gravity loading.
These studies demonstrate that flat slabs without drop panels, flat slabs with drop panels, and flat slabs incorporating both drop panels and edge beams constitute distinct structural systems. Drop panels increase the local slab depth near columns, while edge beams alter the stiffness and force-transfer mechanism at the slab perimeter. Nevertheless, most prior investigations focus on local connection behavior, punching resistance, or collapse mechanisms. Comprehensive comparisons of these configurations as complete floor systems, including their effects on total concrete quantity, reinforcement demand, structural weight, cost, carbon emissions, and vertical natural frequency, are limited.
1.4. Cost, Embodied Carbon, and Optimization of Slab Systems
Recent research has expanded slab-system assessment beyond strength and serviceability to include economic and environmental performance. Paik and Na [18] evaluated carbon dioxide emissions associated with alternative slab systems during construction, showing that slab selection can significantly influence a building's environmental impact. Na and Paik [19] similarly examined the potential reduction in greenhouse-gas emissions and construction cost through the use of alternative structural slab systems.
Jayasinghe et al. [20] compared the embodied carbon and cost of different concrete floor solutions and showed that structural selection should consider economic and environmental objectives together. Afzal et al. [21] critically reviewed reinforced-concrete structural-design optimization and identified the importance of selecting appropriate design variables, objective functions, and structural constraints. More recently, Paknahad et al. [22] examined optimized embodied carbon and cost in reinforced-concrete slab structures, further demonstrating that the preferred structural solution can change according to the selected performance objective.
Broader reviews by Cabeza et al. [23] and Minunno et al. [24] identified concrete and reinforcing steel as major contributors to the embodied energy and embodied carbon of building structures. These studies support using material quantities as important indicators in the environmental assessment of reinforced-concrete floor systems.
The published literature establishes a close relationship among slab configuration, material quantity, cost, and embodied carbon. However, many economic and environmental comparisons do not simultaneously incorporate structural stiffness or vibration indicators. Conversely, studies focusing on slab stiffness, punching shear, or load-transfer mechanisms typically do not quantify whole-building cost and carbon emissions. This separation between structural and sustainability assessments highlights the need for an integrated comparative framework.
1.5. Kuwait Context and Research Gap
Research specifically related to Kuwait provides important information about local structural-design and construction conditions. Awida [4] investigated the structural behavior of low-, medium-, and high-rise reinforced-concrete residential buildings in Kuwait and highlighted the influence of building height, stiffness distribution, and the interaction between gravity and lateral-force-resisting systems. Almansour and Krarti [5] applied a value-engineering optimization approach to high-performance residential buildings in Kuwait, demonstrating the importance of evaluating alternative design decisions rather than relying only on conventional or initially selected solutions.
These studies offer valuable local context, yet they do not directly compare multiple reinforced-concrete slab systems for the same Kuwait residential building using a controlled set of structural, economic, environmental, and vibration-related criteria. Similarly, the international slab literature generally focuses on individual mechanisms, specific slab configurations, or selected cost and carbon indicators.
Accordingly, this study addresses the research gap of a design-oriented, whole-building comparison of several conventional reinforced-concrete slab systems under identical architectural, material, support, and loading conditions for a residential building relevant to Kuwait. This work is novel not for introducing a new slab system or finite-element formulation, but for integrating six slab alternatives into a single comparative framework that simultaneously considers reinforcement quantity, concrete quantity, total structural weight, material cost, carbon dioxide emissions, and vertical natural frequency. This integrated approach enables direct identification of the trade-off between structural stiffness and material efficiency and provides practicing engineers with evidence to select a slab system according to the governing project objective.
Table 1 consolidates the preceding literature review by summarizing the principal research areas, the main contributions of previous studies, and the limitations addressed by the integrated comparative framework adopted in this study.
| Research Area | References | Main Contribution of Previous Research | Remaining Gap Relative to the Present Study |
|---|---|---|---|
| Design and behavior of conventional slabs | [3, 9, 10] | Examined bending-moment coefficients, evolution of two-way slab design, limit-load behavior, panel geometry, and support conditions | Did not compare several complete floor systems within the same residential building |
| Punching shear and slab-column behavior | [11-14] | Investigated punching resistance, column geometry, moment redistribution, slab rotation, and membrane action | Focused mainly on local connection behavior rather than whole-building material and cost performance |
| Drop panels, column heads, and edge beams | [15-17, 25] | Evaluated local strengthening, punching capacity, and collapse response of flat slab systems | Did not simultaneously quantify concrete, reinforcement, weight, cost, emissions, and vertical frequency |
| Cost and carbon assessment | [18-20, 22] | Compared slab alternatives using construction cost, embodied carbon, or both | Limited integration with whole-building stiffness and vibration indicators |
| Structural optimization and environmental reviews | [21, 23, 24] | Established broader optimization and embodied-carbon frameworks for structural materials | Provided general methodologies rather than a Kuwait-specific comparison of conventional slab options |
| Kuwait residential-building studies | [4, 5] | Examined structural behavior and value-engineering considerations for residential buildings in Kuwait | Did not perform a controlled six-system slab comparison using combined structural, economic, and environmental criteria |
2. MATERIALS AND METHODS
2.1. Study Framework
This study adopted a controlled comparative framework to evaluate six reinforced concrete slab systems for the same residential building in Kuwait. The research process began with selection of the case-study building and review of the architectural requirements, followed by development of six slab alternatives, preliminary code-based sizing, three-dimensional structural modeling in CSI ETABS, assignment of gravity and lateral loads, and final comparison using a decision-making matrix. The overall workflow used in the study is illustrated in Fig. (1). To ensure a fair comparison, all alternatives were assessed using the same architectural plan, story height, support conditions, and loading assumptions, such that the slab system remained the principal variable affecting the results.
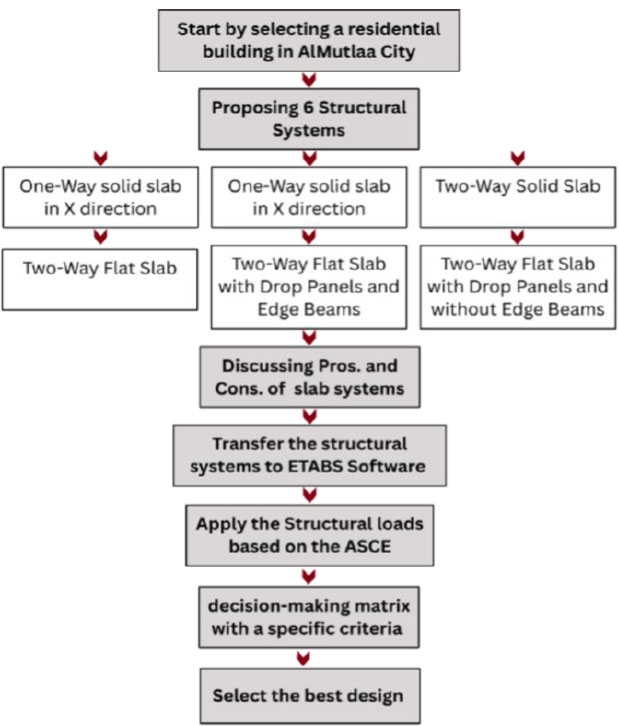
Study workflow methodology.
2.2. Case Study
The case study is a four-story reinforced concrete residential building located in Al-Mutlaa City, Kuwait. Each floor has a story height of 3.0 m. The adopted building geometry and architectural layout are shown in Fig. (2), where Fig. (2a) presents the three-dimensional residential building and Fig. (2b) presents the architectural plan used for structural modeling. The same plan dimensions, story configuration, and general structural arrangement were maintained for all slab alternatives so that the influence of slab selection could be evaluated on a consistent basis.
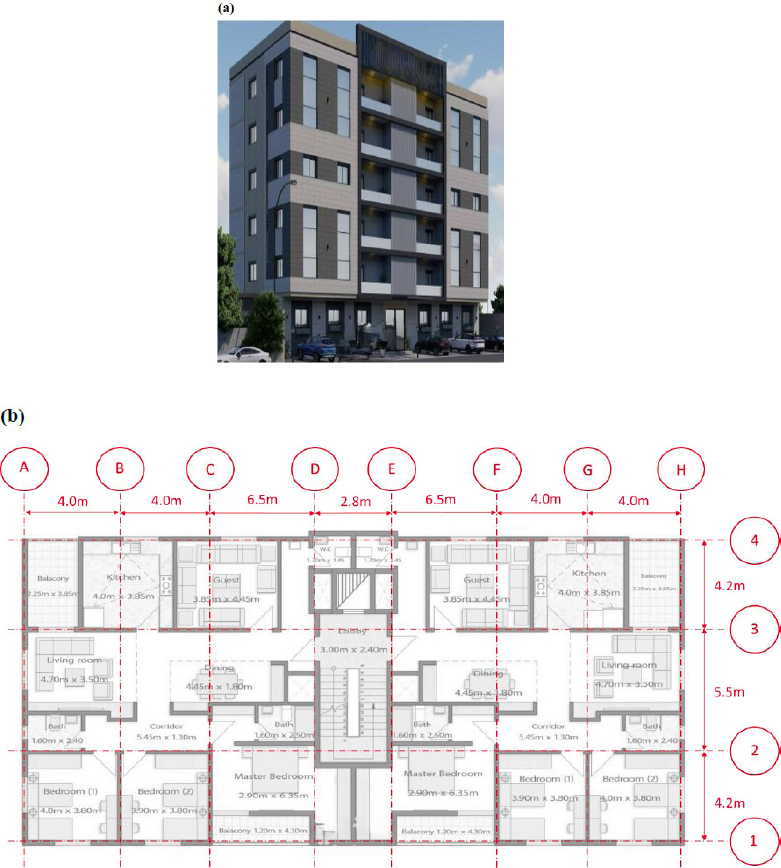
Architectural design of case study. (a) shows the 3D residential building, and (b) shows the architectural plan with the provided dimensions.
2.3. Proposed Design Options
Six reinforced concrete slab systems commonly used in residential construction were selected for comparison: (1) one-way solid slab supported by beams in the x-direction (Fig. 3a); (2) one-way solid slab supported by beams in the y-direction (Fig. 3b); (3) two-way solid slab (Fig. 3c); (4) two-way flat slab (Fig. 3d); (5) two-way flat slab with drop panels (Fig. 3e); and (6) two-way flat slab with drop panels and edge beams (Fig. 3f). Finite element models for these alternatives were generated in CSI ETABS, as shown in Fig. (3), which presents both three-dimensional and plan views for each system. The architectural geometry, material properties, loading definitions, and shear-wall arrangement were maintained consistently, while each floor-system alternative was assigned the slab, beam, column, and drop-panel dimensions required by its load-transfer mechanism. The comparison therefore represents complete code-compliant structural-system alternatives rather than the isolated effect of slab type alone.
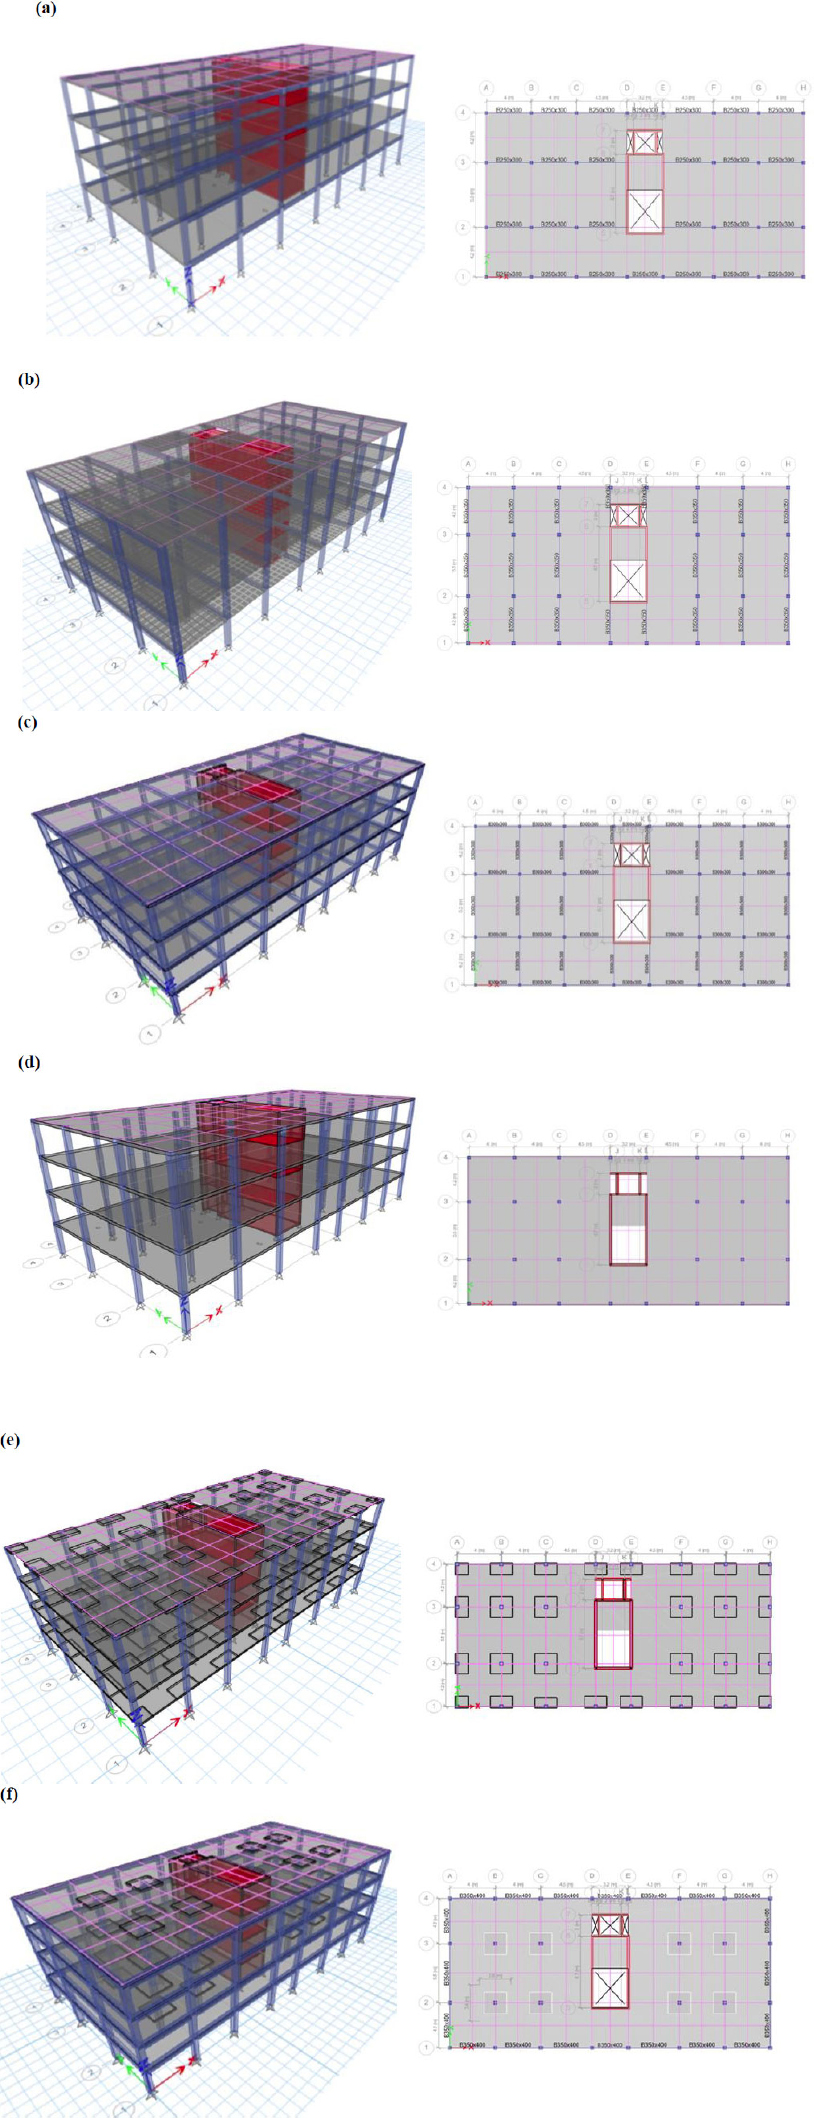
The generated finite element model using CSI ETABS, showing a 3D model view on the left and a plan view on the right for: (a) a one-way solid slab system with beams in the x-direction, (b) one-way solid slab system with beams in the y-direction, (c) two-way solid slab system, (d) two-way flat slab system, (e) two-way flat slab system with drop panels, and (f) two-way flat slab system with edge beams and drop panels.
2.4. Preliminary Design and Structural Element Dimensions
Slab thickness, beam dimensions, column sizes, and drop-panel thicknesses were determined through an iterative design process in accordance with ACI 318-19 requirements for strength and serviceability [1]. The final dimensions for all six alternatives are summarized in Table 2. To ensure a consistent lateral-force-resisting system, each option incorporated a 200 mm shear wall. This methodology ensured that observed variations in results were primarily due to the floor system rather than changes in the overall structural arrangement. Special consideration was given to flat slab alternatives, as slab thickness and local support regions are critical to their structural response [1, 11-17].
Table 2.
| - | Beam Size (mm) | Column Size (mm) | Slab Thickness (mm) | Drop Panels Thickness (mm) |
|---|---|---|---|---|
| Option 1 | 250x300 | 300x300 | 220 | No drop panels |
| Option 2 | 350x350 | 350x350 | 180 | No drop panels |
| Option 3 | 300x300 | 300x300 | 180 | No drop panels |
| Option 4 | No beams | 300x300 | 220 | No drop panels |
| Option 5 | No beams | 350x350 | 160 | 210 |
| Option 6 | 350x400 | 300x300 | 170 | 220 |
Punching shear and long-term vertical deflection were treated as structural feasibility constraints rather than as ranking criteria. An alternative was included in the comparative decision framework only after the applicable strength and serviceability requirements had been satisfied. The common design-convergence and acceptance checks are summarized in Table A1, while the final punching-shear ratios and long-term deflection values are presented in Table A2.
The final member dimensions obtained through the iterative sizing procedure are summarized in Table 2. Because the beam-supported and flat-slab alternatives require different supporting-member arrangements, the reported material, cost, and environmental differences represent the combined effect of each complete floor system and its associated code-compliant member sizing. They should not be interpreted as the isolated effect of slab thickness alone.
2.5. Structural Modeling and Analysis
All six alternatives were modeled in CSI ETABS using the same material properties, boundary conditions, finite-element formulations, mesh settings, reinforced-concrete design assumptions, and stiffness-modification approach. Normal-weight concrete with a specified compressive strength, f’c, of 30 MPa and reinforcing steel with a yield strength, fy, of 420 MPa were adopted for all structural alternatives.
The bases of the columns and shear walls were assigned pinned restraints. Beams and columns were represented using frame elements, whereas the floor slabs and 200 mm reinforced-concrete shear walls were represented using thin-shell area elements. Each floor was assigned a semi-rigid diaphragm so that the in-plane diaphragm response was represented through the stiffness of the slab shell elements rather than through an infinitely rigid floor constraint. The slab and wall area elements were automatically meshed using a maximum element dimension of 1.0 m.
The flexural design of the slabs was performed using ETABS design strips. The design-strip layouts were arranged in the principal slab directions to obtain the required reinforcement under the adopted design combinations. The shear walls were modeled separately as thin-shell wall elements and were not designed using slab design strips.
The adopted clear concrete covers were 40 mm for beams and columns, 20 mm for slabs and walls, and 50 mm for footings. The footing cover should be interpreted according to the footing construction and exposure conditions; where footing concrete is cast directly against and remains in contact with the ground, the applicable ACI 318-19 cover requirement governs.
Cracked-section behavior was represented using adopted flexural stiffness modifiers of 0.25 for slab bending, 0.35 for beam bending, and 0.70 for column and wall bending. These modifiers were applied consistently to all six alternatives. The modifiers affected the analytical stiffness of the members but did not alter their physical dimensions, material density, or calculated self-weight. Structural self-weight was generated automatically by ETABS and included in the dead-load case.
Modal analysis was performed in ETABS to determine the natural periods, corresponding natural frequencies, and mode-shape characteristics of the six structural alternatives. The vertical natural frequency was used only as a comparative indicator of the relative vertical modal characteristics of the complete analytical models. It was not used as a comprehensive measure of floor-vibration acceptability or occupant comfort.
The X- and Y-direction values reported in Appendix A - Table A3 correspond to the directional components of Mode 1 obtained from the ETABS modal analysis. They are mode-shape ordinates rather than physical displacements produced by an applied earthquake or wind load case. Accordingly, these values are presented only as supplementary information describing the Mode 1 deformation pattern and are not compared against code-prescribed story-drift limits.
A complete floor-vibration assessment would require additional consideration of mode shapes, modal participation, modal mass, damping, excitation characteristics, acceleration response, and the applicable vibration-serviceability criteria.
2.6. Structural Loading
The structural loads adopted in the analysis are listed in Table 3. The superimposed dead load consisted of ceramic tiles (0.23 kN/m2), sand bed (2.35 kN/m2), mortar finish (0.59 kN/m2), partition wall allowance (0.96 kN/m2), services (0.25 kN/m2), and ceiling finish (0.10 kN/m2). A live load of 1.92 kN/m2 was assigned to residential rooms and corridors in accordance with ASCE/SEI 7-16 [2]. Seismic loading was represented using the adopted design spectral response parameters as listed in Table 3.
| Load Type | Values |
|---|---|
| Superimposed dead load, Ceramic Tiles | 0.23 kN/m2 |
| Superimposed dead load, Sand Bed | 2.35 kN/m2 |
| Superimposed dead load, Mortar (Dead Load) | 0.59 kN/m2 |
| Superimposed dead load, Partition Walls | 0.96 kN/m2 |
| Self-weight of the structural elements is automatically determined by ETABS | |
| Services (Dead Load) | 0.25 kN/m2 |
| Ceiling (Dead Load) | 0.1 kN/m2 |
| Live Load (Residential Rooms & Corridors) | 1.92 kN/m2 |
| Seismic Load Parameters - SDS | 0.20667 |
| Seismic Load Parameters - SD1 | 0.190667 |
| Wind Load Pressure (qz) | Based on qz = 0.613 x Kz x Kzt x Kd x V2 |
Kz: Velocity pressure exposure coefficient equal to 1.267.
Kzt: Topographic factor equal to 1 (flat ground).
Kd: Directionality factor equal to 0.85.
Wind load was estimated using a standard equation that includes wind speed, height, and building shape factors. These values help ensure the building can safely handle vertical and lateral forces. Because the same load values were applied to all six alternatives, any difference in response is attributable to the slab configuration rather than to the loading model.
2.7. Load Combinations
To ensure realistic and code-compliant structural behavior, various load combinations were applied during the analysis of the residential building. These combinations were developed in accordance with the ASCE 7-16 standard, which provides guidance on evaluating structural performance under different loading scenarios. The loads considered include dead load, live load, wind load, and temperature load, reflecting typical conditions a residential structure may encounter throughout its service life. By combining these loads in different proportions, the analysis captures both regular service conditions and potential extreme events, ensuring adequate strength, safety, and serviceability of the slab systems. The following combinations were considered in the analysis:
The following combinations were considered in the analysis:
1.4 Dead Load
1.2 Dead Load + 1.6 Live Load
1.2 Dead Load + 1.0 Live Load + 1.0 Wind Load
1.2 Dead Load + 1.0 Live Load + 1.0 Earthquake Load
0.9 Dead Load + 1.0 Wind Load
0.9 Dead Load + 1.0 Earthquake Load
2.8. Evaluation Criteria
Following the structural analysis and code-based member-sizing process, each slab alternative was first required to satisfy the applicable strength and serviceability requirements. Only structurally feasible alternatives were included in the comparative ranking. The analytical outputs comprised reinforcement quantity, concrete quantity, total structural weight, structural material cost, material-associated embodied CO2, and vertical natural frequency. To avoid double counting, total structural weight was retained as a descriptive engineering output but was not included as a separate criterion in the composite score because the concrete quantity was derived directly from structural weight.
The concrete volume was estimated from the total structural weight obtained from ETABS using Eq. (1):

where Vc is the estimated concrete volume in m3, Wstr is the total structural weight in kN, and γc is the adopted concrete unit weight of 24 kN/m3.
The cost assessment was limited to the direct material cost of structural concrete and reinforcing steel. The structural material cost of each alternative was calculated using Eq. (2) as:
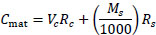
where Cmat is the calculated structural material cost in Kuwaiti Dinars (KD), Rc is the adopted concrete unit rate of 25.1 KD/m3, Ms is the reinforcement mass in kg, and Rs is the adopted reinforcing-steel unit rate of 177 KD/t. The assessment did not include formwork and falsework, shoring and reshoring, labor, equipment, temporary works, transportation, material waste, construction duration, site logistics, contractor overhead, financing, maintenance, or schedule-related costs. Accordingly, the reported values represent a concrete-and-reinforcing-steel material-cost comparison rather than a comprehensive assessment of total installed construction cost.
The environmental indicator was limited to the embodied CO2 associated with structural concrete and reinforcing steel. The material-associated embodied CO2 of each alternative was calculated using Eq. (3) as:

where Emat is the calculated material-associated embodied CO2 in kg, EFc is the concrete emission factor of 383.77 kg CO2/m3, and EFs is the reinforcing-steel emission factor of 3.84 kg CO2/kg. These factors were adopted consistently for all alternatives in accordance with the comparative material-assessment approach described in previous studies [18-24]. The environmental boundary did not include formwork materials, shoring and reshoring, material transportation, construction equipment and energy use, on-site waste, temporary works, maintenance, repair, replacement, demolition, recycling, disposal, or environmental impact categories other than CO2 emissions. Consequently, the calculated values represent a comparative material-associated embodied-CO2 indicator rather than a complete life-cycle assessment or a comprehensive evaluation of overall environmental performance.
Because the performance indicators were expressed in different units and represented conflicting objectives, the alternatives were evaluated using a multi-criteria decision-making framework. Four independent decision dimensions were adopted: (1) material efficiency, represented jointly by reinforcement and concrete quantities; (2) structural material cost; (3) material-associated embodied CO2; and (4) vertical natural frequency. Vertical natural frequency was treated only as a comparative modal indicator of relative vertical stiffness and not as a complete measure of vibration comfort or dynamic acceptability.
2.9. Multi-Criteria Decision-Making Framework
Before the comparative ranking was performed, each slab alternative was required to satisfy the applicable strength and serviceability requirements. The code-compliant alternatives were subsequently evaluated using a multi-criteria decision-making framework because material consumption, cost, environmental impact, and structural stiffness represent competing design objectives.
Four decision dimensions were considered: material efficiency, material cost, carbon dioxide emissions, and vertical natural frequency. Material efficiency was represented by a composite index incorporating reinforcement quantity and concrete quantity. Total structural weight was retained as a descriptive engineering output but was not included as a separate criterion in the composite ranking because concrete quantity was determined directly from structural weight using a concrete unit weight of 24 kN/m3. Including both concrete quantity and structural weight as independent criteria would therefore duplicate the influence of the same underlying variable.
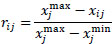
Because the criteria were expressed in different units, min-max normalization was applied. For reinforcement quantity, concrete quantity, material cost, and carbon dioxide emissions, for which lower values represent better performance, the normalized score was calculated using Eq. (4) as:
For vertical natural frequency, for which a higher value indicates greater relative floor stiffness, the normalized score was calculated using Eq. (5) as:
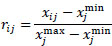
where xij is the value of alternative (i) under criterion (j), and
 and
and
 are the minimum and maximum values of that criterion among the six alternatives. Following normalization, a material-efficiency index was determined for each alternative as the arithmetic mean of its normalized reinforcement and concrete scores using Eq. (6):

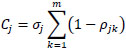
where ri,s and ri,c are the normalized reinforcement and concrete scores. The relative criterion weights were determined using the CRITIC method [26]. This objective-weighting method considers both the variation in the performance values and the degree of correlation between the criteria. The information content of criterion (j) was calculated using Eq. (7) as:
and the corresponding criterion weight was calculated using Eq. (8) as:

where σj is the standard deviation of criterion (j), ρjk is the correlation coefficient between criteria (j) and (k), and (m) is the number of decision criteria. The final composite performance score of each alternative was then calculated using Eq. (9):

A higher value of Si indicates an alternative closer to the preferred combination of lower material use, lower cost, lower carbon emissions, and higher vertical natural frequency. A sensitivity analysis was additionally performed using equal-weight, material-economy- environment-priority, and stiffness-priority scenarios to determine whether the final ranking remained stable when project priorities changed.
3. RESULTS
Six slab alternatives were evaluated using structural, economic, and environmental criteria to identify the most suitable system for the selected four-story residential building. The comparison considered total reinforcement quantity, total concrete quantity, total structural weight, total material cost, total CO2 emissions, and vertical natural frequency. The comparative results are presented in Fig. (4).
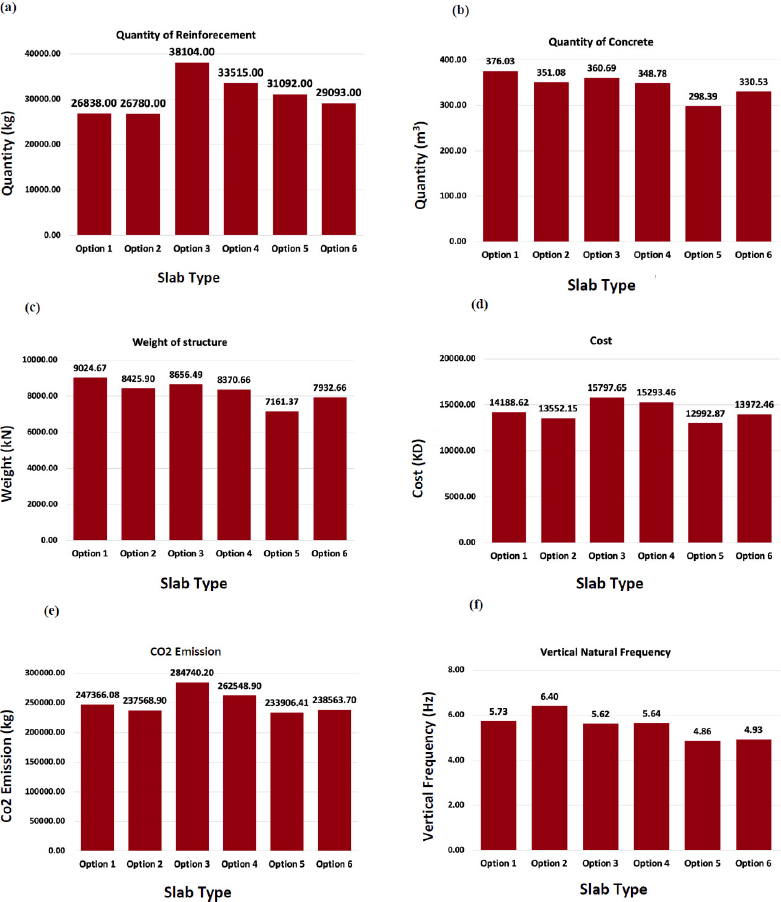
Comparison of slab design options based on different criteria. (a) quantity of reinforcement, (b) quantity of concrete, (c) weight of structure, (d) structural materials cost, (e) CO2 emission, (f) vertical natural frequency.
3.1. Quantity of Reinforcement
The total reinforcement quantity for each alternative was obtained by summing the reinforcement required for slabs, beams, columns, and shear walls. As shown in Fig. (4a), Option 2, the one-way solid slab with beams in the y-direction, required the lowest total reinforcement quantity, equal to 26,780 kg, while Option 3, the two-way solid slab, required the highest total reinforcement quantity, equal to 38,104 kg. The remaining alternatives fell between these two limits, with Option 1 requiring 26,838 kg, Option 4 requiring 33,515 kg, Option 5 requiring 31,092 kg, and Option 6 requiring 29,093 kg. These results show that the one-way framing arrangement in the y-direction used reinforcing steel most efficiently for the selected building configuration, whereas the two-way solid slab demanded substantially more reinforcement because of its bidirectional beam-supported action and higher overall material demand.
3.2. Quantity of Concrete
The quantity of concrete was estimated by dividing the total structural weight obtained from ETABS by the adopted concrete unit weight of 24 kN/m3. As presented in Fig. (4b), Option 5, the two-way flat slab with drop panels and without edge beams, required the lowest concrete quantity, equal to 298.39 m3, whereas Option 1, the one-way solid slab with beams in the x-direction, required the highest quantity, equal to 376.03 m3. The other systems required 351.08 m3 for Option 2, 360.69 m3 for Option 3, 348.78 m3 for Option 4, and 330.53 m3 for Option 6. The result for Option 5 shows that local thickening at the column zones through drop panels can reduce overall concrete usage when compared with thicker beam-supported or beamless slab systems.
3.3. Structural Weight
The total structural weight for each alternative was extracted directly from the ETABS analysis. According to Fig. (4c), Option 1, the one-way solid slab with beams in the x-direction, had the highest structural weight, equal to 9,024.67 kN, while Option 5, the two-way flat slab with drop panels and without edge beams, had the lowest structural weight, equal to 7,161.37 kN. The remaining options had structural weights of 8,425.90 kN for Option 2, 8,656.49 kN for Option 3, 8,370.66 kN for Option 4, and 7,932.66 kN for Option 6. Since self-weight influences column demand, foundation loading, and seismic mass, these results confirm that Option 5 is the lightest and most weight-efficient alternative among the six slab systems considered.
3.4. Structural Materials Cost Estimation
The structural material cost was calculated from the quantities of concrete and reinforcing steel using unit rates of 25.1 KD/m3 for concrete and 177 KD/t for reinforcement. As shown in Fig. (4d), Option 5, the two-way flat slab with drop panels and without edge beams, recorded the lowest calculated structural material cost at 12,992.87 KD. Option 3, the two-way solid slab, recorded the highest structural material cost at 15,797.65 KD. The corresponding values for Options 1, 2, 4, and 6 were 14,188.62 KD, 13,552.15 KD, 15,293.46 KD, and 13,972.46 KD, respectively.
These results reflect only the combined quantities and adopted unit rates of structural concrete and reinforcing steel. They do not represent the total installed cost of the floor systems. Factors such as formwork configuration, shoring and reshoring, labor productivity, construction duration, equipment requirements, temporary works, and contractor overhead were outside the assessment boundary. Therefore, Option 5 should be described as having the lowest calculated structural material cost rather than as being the most economical alternative overall.
3.5. Material-associated Embodied CO2 of Concrete and Reinforcing Steel
The total CO2 emissions were calculated by summing the emissions associated with concrete and reinforcement, using emission factors of 383.77 kg CO2/m3 for concrete and 3.84 kg CO2/kg for reinforcing steel. As illustrated in Fig. (4e), Option 5, the two-way flat slab with drop panels and without edge beams, produced the lowest total CO2 emissions, equal to 233,906.41 kg, while Option 3, the two-way solid slab, produced the highest total CO2 emissions, equal to 284,740.20 kg. The other systems produced 247,366.08 kg for Option 1, 237,568.90 kg for Option 2, 262,548.90 kg for Option 4, and 238,563.70 kg for Option 6. This pattern follows the relative material quantities and confirms that systems needing lower volumes of concrete and steel achieve better environmental performance within the material-based assessment adopted in this study.
3.6. Vertical Natural Frequency
The vertical natural frequency was obtained from the ETABS modal analysis by taking the inverse of the relevant vibration period. As shown in Fig. (4f), Option 2, the one-way solid slab with beams in the y-direction, achieved the highest vertical natural frequency, equal to 6.40 Hz, indicating the stiffest floor response among the six alternatives. In contrast, Option 5, the two-way flat slab with drop panels and without edge beams, recorded the lowest vertical natural frequency, equal to 4.86 Hz, indicating the most flexible response. The other alternatives recorded 5.73 Hz for Option 1, 5.62 Hz for Option 3, 5.64 Hz for Option 4, and 4.93 Hz for Option 6. These results show clearly that the slab system with the best material and environmental performance is not necessarily the stiffest system.
3.7. Multi-citeria Decision Analysis
Application of the CRITIC method produced weights of 0.1305 for material efficiency, 0.1814 for material cost, 0.1786 for carbon dioxide emissions, and 0.5095 for vertical natural frequency.
The relatively high weight assigned to vertical natural frequency resulted from its stronger contrast with the material-based criteria, whereas material quantity, cost, and carbon emissions were comparatively highly correlated. Table 4 shows the normalized multi-criteria scores and final ranking of the slab alternatives.
| Alternative | Material Efficiency | Cost | Material-associated Embodied CO2 | Vertical Frequency | Composite Score | Rank |
|---|---|---|---|---|---|---|
| Option 1 | 0.4974 | 0.5737 | 0.7352 | 0.5649 | 0.5881 | 2 |
| Option 2 | 0.6607 | 0.8006 | 0.9280 | 1.0000 | 0.9067 | 1 |
| Option 3 | 0.0988 | 0.0000 | 0.0000 | 0.4935 | 0.2643 | 6 |
| Option 4 | 0.3781 | 0.1798 | 0.4365 | 0.5065 | 0.4180 | 4 |
| Option 5 | 0.8096 | 1.0000 | 1.0000 | 0.0000 | 0.4657 | 3 |
| Option 6 | 0.6909 | 0.6507 | 0.9084 | 0.0455 | 0.3936 | 5 |
Option 2 achieved the highest composite score of 0.9067 and was therefore the highest-ranked alternative under the data-driven weighting model. Its ranking resulted from combining the highest vertical natural frequency with the lowest reinforcement quantity and comparatively favorable cost and carbon-emission values. Option 5 achieved the best individual performance for concrete quantity, structural weight, cost, and carbon dioxide emissions, but its low vertical natural frequency reduced its composite score when structural stiffness was included in the decision framework.
The sensitivity analysis confirmed that the preferred alternative depends on the priorities adopted for the project. Option 2 remained the highest-ranked alternative under both the CRITIC weighting and an equal-weight scenario. Option 5 became the highest-ranked alternative when material efficiency, cost, and carbon emissions were each assigned a weight of 0.30 and vertical natural frequency was assigned a weight of 0.10. Consequently, Option 5 should be described as the preferred economy- and sustainability-oriented alternative rather than as the universally preferred slab system.
4. DISCUSSION
The results in Fig. (4) highlight three findings of direct practical importance for structural engineers involved in residential reinforced concrete design. The comparison shows that slab-system selection should be based on the governing project objective rather than on routine preference for a familiar system.
4.1. Framing Direction Strongly Influences the Efficiency of One-way Slab Systems
The comparison between Options 1 and 2 demonstrates that changing the beam orientation modifies the load path of the complete one-way floor system. As shown in Figs. (2 and 3), the building plan is not rotationally symmetric and contains unequal bay arrangements and a central core. Rotating the beam direction therefore changes the effective slab spans, beam tributary widths, continuity across supports, and the relationship between the framing lines and the core. These changes influence the distribution of positive and negative bending moments and, consequently, the member dimensions obtained through the iterative design procedure [3, 9, 10].
Consequently, the two one-way alternatives converged to different code-compliant member arrangements. Option 1 used a 220 mm slab, 250 × 300 mm beams, and 300 × 300 mm columns, whereas Option 2 used a thinner 180 mm slab with larger 350 × 350 mm beams and columns. Although Option 2 recorded the lowest reinforcement quantity at 26,780 kg, the difference from Option 1, which required 26,838 kg, was only 58 kg, or approximately 0.2%. The results therefore do not demonstrate a substantial reduction in total reinforcement attributable to beam orientation alone.
The more significant differences were observed in concrete quantity, structural weight, and vertical natural frequency. Compared with Option 1, Option 2 used about 6.6% less concrete and had about 6.6% lower structural weight, while its selected vertical natural frequency was about 11.7% higher. The thinner slab reduced concrete and distributed mass over the full floor area, while the larger beams and columns concentrated flexural stiffness along the principal framing lines. This redistribution of material explains the improved stiffness-to-mass balance and the higher selected modal frequency of Option 2. However, the natural-frequency result is used only as a comparative modal indicator and does not constitute a complete assessment of floor vibration performance.
Because beam orientation and member dimensions changed together during the iterative design process, the observed differences cannot be attributed exclusively to framing direction. Instead, they represent the combined response of two complete structural-system alternatives. The practical implication is that preliminary design should examine both one-way framing directions, particularly for buildings with unequal bay dimensions or irregular support arrangements. Under the adopted multi-criteria framework, the favorable balance of material use and modal response contributed to Option 2 receiving the highest overall ranking.
4.2. The Preferred Slab System Depends on the Adopted Decision Priorities
The multi-criteria analysis demonstrates that no single slab system provides the maximum performance under every evaluation criterion. Under the data-driven CRITIC weighting, Option 2, the one-way solid slab with beams in the y-direction, achieved the highest composite score because it combined the highest vertical natural frequency, the lowest reinforcement quantity, and comparatively favorable economic and environmental performance. It therefore represents the strongest overall compromise when all four decision dimensions are included.
Option 5, the two-way flat slab with drop panels and without edge beams, remains the most favorable alternative when the principal objectives are minimizing concrete consumption, structural weight, material cost, and carbon dioxide emissions. However, it should not be described as the universally optimal alternative because it recorded the lowest vertical natural frequency. The sensitivity analysis showed that Option 5 became the highest-ranked system only when the combined material, economic, and environmental criteria were assigned substantially greater importance than structural stiffness. Accordingly, the final selection should be linked explicitly to the project priorities rather than presented as a criterion-independent optimum.
The lower concrete quantity in Option 5 can be explained by how structural depth was distributed within the floor system. Option 5 used a 160 mm field slab with 210 mm drop-panel zones, whereas the flat slab without drop panels in Option 4 required a uniform slab thickness of 220 mm. The drop panels concentrate additional effective depth and flexural stiffness around the columns, where negative bending moments and punching-shear demand are highest, while allowing a thinner slab over most of the floor area. Because the locally thickened regions occupy only a limited portion of the total floor area, the additional concrete at the columns was smaller than the concrete saved by reducing the field-slab thickness. This explains why Option 5 achieved a lower total concrete quantity than the uniformly thicker flat slab. Similarly, Option 6 required additional concrete for both the drop panels and the edge beams, which explains why its concrete quantity exceeded that of Option 5. This interpretation applies to the final code-compliant systems and should not be understood as evidence that drop panels will reduce concrete quantity for every building geometry or span arrangement.
4.3. The Conventional Two-way Solid Slab is Robust, but not the most Effective Choice for this Case Study
Option 3, the conventional two-way solid slab, transfers loads to supports in both principal directions. This bidirectional behavior can improve moment redistribution and continuity because gravity loads are shared among orthogonal beam lines. However, the same mechanism also requires reinforcement in both principal slab directions, including positive reinforcement within the spans and negative reinforcement over the supporting beam lines. In the selected model, 300 × 300 mm beams supported the 180 mm slab and extended in both directions. The orthogonal beam grid therefore added concrete and self-weight, while two-way moment distribution increased the reinforcement required across the floor [3, 9, 10].
This structural arrangement helps explain why Option 3 required the highest reinforcement quantity, 38,104 kg, approximately 42.3% greater than the reinforcement required by Option 2. Option 3 also had a relatively high concrete quantity of 360.69 m3 and structural weight of 8,656.49 kN. However, it should not be described as the worst alternative for every material indicator because Option 1 recorded the highest concrete quantity and structural weight. Option 3 performed poorly under the adopted material-based comparison mainly because of its particularly high reinforcement demand and relatively high concrete volume.
Because the structural material-cost and embodied-CO2 calculations were based only on concrete and reinforcing steel, this combined material demand resulted in Option 3 recording the highest calculated structural material cost of 15,797.65 KD and the highest material-associated embodied CO2 of 284,740.20 kg. These findings indicate comparatively high concrete- and steel-related impacts within the adopted calculation boundaries. They do not establish that Option 3 necessarily has the highest total installed construction cost or the greatest overall life-cycle environmental impact, because the study did not assess formwork, labor, construction duration, equipment, transportation, maintenance, or end-of-life stages [18-24].
Option 3 recorded an intermediate vertical natural frequency of 5.62 Hz. This result does not demonstrate a compensating dynamic advantage because natural frequency alone cannot characterize vibration comfort, damping, excitation response, or acceleration. In the revised multi-criteria assessment, the material penalties of Option 3 were not offset by a leading modal-frequency result, and it therefore remained the lowest-ranked alternative under the adopted data-driven weighting.
The practical implication is not that two-way beam-supported slabs are structurally unsuitable, but that their familiar bidirectional load path may carry a material penalty for the particular geometry and spans examined in this study. Option 2 represents the highest-ranked overall compromise under the adopted multi-criteria framework. In contrast, Option 5 remains preferable when reducing structural weight, concrete-and-steel material cost, and material-associated embodied CO2 take priority. These conclusions are specific to the selected building, final member dimensions, and assessment boundaries.
4.4. Scope of the Structural-performance Comparison
The supplementary verification results clarify the scope of the comparison. The six alternatives were not analyzed using artificially identical slab, beam, column, and drop-panel dimensions. Instead, each alternative was independently developed into a practical code-compliant design using the same strength and serviceability acceptance criteria. The comparison therefore evaluates complete structural-system alternatives and includes the member-sizing consequences associated with each slab-system configuration.
As shown in Appendix A-Table A2, the final long-term deflections of the six alternatives remained within the adopted serviceability limit, subject to confirmation of the unrounded governing value for Option 6. The same table shows that the maximum punching-shear ratios for the direct slab-column alternatives remained below unity. These checks support the structural feasibility of the alternatives included in the comparative analysis.
The Mode 1 values presented in Appendix A-Table A3 must be interpreted separately from the wind and seismic load analysis. They represent the X- and Y-direction components of the first mode shape and were not generated through the application of earthquake loading. Therefore, the values are not used to establish seismic drift performance, wind performance, or the proportion of lateral force resisted by the slabs, frames, and shear walls.
Wind and seismic loads affected the code-based analysis and may have influenced the final required member dimensions. However, because load-case-specific displacement, inter-story drift, base-shear, diaphragm-force, and wall-force results were not compared, the independent influence of lateral loading on the relative performance of the six floor systems cannot be quantified from the present results. The common shear-wall system provides a consistent lateral-resistance basis, but it does not completely eliminate the effects of differences in structural mass, diaphragm behavior, and beam-column framing.
Accordingly, wind and seismic loads should be understood as common code-compliance actions included in the design procedure rather than as separately evaluated performance indicators. Future work should compare the actual ETABS results obtained from the relevant wind and earthquake load cases to quantify their influence on each complete structural alternative.
CONCLUSION
This study compared six reinforced concrete slab systems for a four-story residential building in Kuwait, using the same building geometry, support conditions, and loading assumptions. The results show that slab-system selection should be based on the governing project objective rather than on routine design preference.
The objective multi-criteria analysis ranked Option 2, the one-way solid slab with beams in the y-direction, as the highest-performing overall compromise for the selected case study. Option 2 achieved the highest composite score because it combined the highest vertical natural frequency of 6.40 Hz, the lowest reinforcement quantity of 26,780 kg, and comparatively favorable cost and carbon-emission performance.
Option 5, the two-way flat slab with drop panels and without edge beams, achieved the lowest concrete quantity, structural weight, material cost, and carbon dioxide emissions. It is therefore the preferred alternative when material efficiency, economy, and embodied-carbon reduction are the dominant project objectives. However, its lower vertical natural frequency prevents it from being identified as a universally optimal solution. The sensitivity analysis demonstrated that the preferred slab system changes with the adopted criterion weights. Accordingly, the principal practical contribution of this study is not the identification of one slab system as universally superior, but the establishment of a transparent framework through which designers can select an alternative according to explicitly defined project priorities.
The present study is limited to one residential building layout, one set of span arrangements, and a material-based comparison of cost and CO2 emissions. Subsequent research should investigate different span lengths, diaphragm action and in-plane slab deformation, more detailed serviceability checks, and additional slab types such as waffle slabs and one-way ribbed slabs.
AUTHORS’ CONTRIBUTIONS
The authors confirm their contributions to the paper as follows: Y.A.: Study conception and design; W.A., M.A., R.A., Z.A., and M.M.: Data collection; Y.A., W.A., M.A., R.A., Z.A., and M.M.: Analysis and interpretation of results; W.A., M.A., R.A., Z.A., and M.M.: Draft manuscript; Y.A.: Supervision, manuscript review, and final editing. All authors reviewed the results and approved the final version of the manuscript.
LIST OF ABBREVIATIONS
| ACI | = American Concrete Institute |
| ASCE | = American Society of Civil Engineers |
| ASCE/SEI | = American Society of Civil Engineers / Structural Engineering Institute |
| CO2 | = Carbon dioxide |
| ETABS | = Extended Three-Dimensional Analysis of Building Systems |
| KD | = Kuwaiti Dinar |
| RC | = Reinforced concrete |
| SDS | = Design spectral response acceleration parameter at short period |
| SD1 | = Design spectral response acceleration parameter at 1-second period |
| qz | = Velocity pressure |
| V | = Wind Speed |
| Kz | = Velocity pressure exposure coefficient |
| Kzt | = Topographic factor |
| Kd | = Wind directionality factor |
| CRITIC | = Criteria Importance Through Intercriteria Correlation |
| MCDM | = Multi-Criteria Decision-Making |
AVAILABILITY OF DATA AND MATERIALS
The data supporting the findings and the ETABS models of the article are available in the Zenodo Repository at https://doi.org/10.5281/zenodo.15429265.
ACKNOWLEDGEMENTS
The authors acknowledge the use of Grammarly Pro for language checking and editing of the manuscript. All suggested revisions were reviewed by the authors, who take full responsibility for the final content.
APPENDIX A - Supplementary Design-Convergence, Serviceability, and Modal-Analysis Results
A.1. Common Design Basis and Iterative Sizing Procedure
All six alternatives were developed using the same architectural plan, story heights, material properties, support conditions, gravity-load definitions, wind and seismic parameters, and 200 mm shear-wall arrangement. The principal differences between the models were the floor-system topology and the beam, column, slab, and drop-panel dimensions required to provide a practical code-compliant representation of each topology.
The design procedure consisted of preliminary member sizing, ETABS analysis, code-based member design, review of strength and serviceability outputs, modification of controlling member dimensions where necessary, and reanalysis. The process was repeated until the applicable structural checks were satisfied. The final dimensions reported in Table 2 represent the converged sections adopted for the comparative assessment.
The principal checks used during the iterative sizing procedure are summarized in Table A1.
| Check | Application | Acceptance Basis |
|---|---|---|
| Slab and beam flexure | All applicable alternatives | ACI-based ETABS design requirements satisfied |
| One-way shear | All applicable alternatives | ACI-based ETABS design requirements satisfied |
| Column and beam capacity | Beam-supported and framed alternatives | Applicable ETABS design requirements satisfied |
| Punching shear | Direct slab-column load-transfer regions | Maximum demand-to-capacity ratio not greater than 1.0 |
| Long-term vertical deflection | All alternatives | Not greater than (L/240) |
| Wind and seismic combinations | All alternatives | Common lateral-load inputs and design combinations |
| Vertical natural frequency | All alternatives | Comparative modal indicator only |
| Mode 1 directional components | All alternatives | Supplementary mode-shape information only |
A.2. Punching-Shear and Long-Term Deflection Results
The maximum span used to establish the long-term deflection limit was 6.5 m. Therefore, the adopted (L/240) limit was 27.08 mm, which is approximately 27.1 mm when rounded to one decimal place.
The long-term deflection was calculated using the ACI-based procedure and the sustained-load combination defined in ETABS. The final punching-shear and long-term deflection results are summarized in Table A2.
| Option | Maximum Punching-Shear Ratio | Maximum Long-Term Deflection (mm) | Verification |
|---|---|---|---|
| 1 | Not applicable | 20.5 | Satisfies the adopted deflection limit |
| 2 | Not applicable | 19.4 | Satisfies the adopted deflection limit |
| 3 | Not applicable | 21.4 | Satisfies the adopted deflection limit |
| 4 | 0.76 | 22.3 | Satisfies the adopted limits |
| 5 | 0.78 | 26.5 | Satisfies the adopted limits |
| 6 | 0.74 | 27.1, rounded | Governing rounded value; verify using the unrounded ETABS result |
For Options 1-3, punching shear was not reported as an applicable direct slab-column check because the slabs transferred gravity loads to the columns through beams. For Options 4-6, the punching-shear ratios remained below 1.0, indicating that the corresponding direct slab-column regions satisfied the adopted acceptance criterion.
A.3. Mode 1 Modal Response in the X and Y Directions
The ETABS-reported X- and Y-direction components of Mode 1 are presented in Table A3. These values were extracted from the eigenvalue modal analysis using the same analysis settings for all six alternatives. They were not calculated from an earthquake or wind load case.
| Option | Level | Elevation (m) | Mode 1 X Component (mm) |
Mode 1 Y Component (mm) |
|---|---|---|---|---|
| 1 | Story 4 | 12 | 33.346 | 49.385 |
| 1 | Story 3 | 9 | 27.200 | 40.983 |
| 1 | Story 2 | 6 | 18.817 | 28.852 |
| 1 | Story 1 | 3 | 9.793 | 15.483 |
| 1 | Base | 0 | 0.000 | 0.000 |
| 2 | Story 4 | 12 | 33.038 | 48.638 |
| 2 | Story 3 | 9 | 26.793 | 40.150 |
| 2 | Story 2 | 6 | 18.288 | 27.919 |
| 2 | Story 1 | 3 | 9.133 | 14.338 |
| 2 | Base | 0 | 0.000 | 0.000 |
| 3 | Story 4 | 12 | 27.522 | 40.414 |
| 3 | Story 3 | 9 | 22.252 | 33.249 |
| 3 | Story 2 | 6 | 15.122 | 23.016 |
| 3 | Story 1 | 3 | 7.504 | 11.738 |
| 3 | Base | 0 | 0.000 | 0.000 |
| 4 | Story 4 | 12 | 32.975 | 48.863 |
| 4 | Story 3 | 9 | 26.814 | 40.447 |
| 4 | Story 2 | 6 | 18.356 | 28.211 |
| 4 | Story 1 | 3 | 9.285 | 14.731 |
| 4 | Base | 0 | 0.000 | 0.000 |
| 5 | Story 4 | 12 | 35.669 | 53.021 |
| 5 | Story 3 | 9 | 28.683 | 43.328 |
| 5 | Story 2 | 6 | 19.408 | 29.825 |
| 5 | Story 1 | 3 | 9.633 | 15.198 |
| 5 | Base | 0 | 0.000 | 0.000 |
| 6 | Story 4 | 12 | 32.982 | 49.517 |
| 6 | Story 3 | 9 | 27.070 | 41.321 |
| 6 | Story 2 | 6 | 18.820 | 29.255 |
| 6 | Story 1 | 3 | 9.926 | 15.870 |
| 6 | Base | 0 | 0.000 | 0.000 |
The values in Table A3 describe the directional modal components of Mode 1 and show how the modal amplitude varies with elevation within each analytical model. They are not earthquake-induced story displacements, inter-story drifts, or wind-induced responses.
Because eigenvalue mode shapes are normalized according to the modal-analysis procedure, their absolute magnitudes should not be interpreted as physical displacements produced by a specified loading event. The values are therefore presented as supplementary mode-shape information and are not used as a decision criterion or checked against code-prescribed lateral-drift limits.